Breaking Down Spatial Anchors in AR/MR
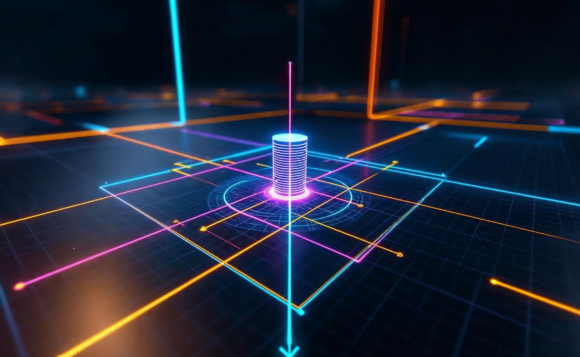
Augmented Reality (AR) and Mixed Reality (MR) depend on accurate understanding of the physical environment to create realistic experiences, and they hit this target with the concept of spatial anchors. These anchors act like markers, either geometric or based on features, that help virtual objects stay in the same spot in the real world — even when users move around.
Sounds simple, but the way spatial anchors are implemented varies a lot depending on the platform; for example, Apple’s ARKit, Google’s ARCore, and Microsoft’s Azure Spatial Anchors (ASA) all approach them differently.
If you want to know how these anchors are used in practical scenarios or what challenges developers often face when working with them, this article dives into these insights too.
What Are Spatial Anchors and Why They Matter
A spatial anchor is like a marker in the real world, tied to a specific point or group of features. Once you create one, it allows for some important capabilities:
- Persistence. Virtual objects stay exactly where you placed them in the real-world, even if you close and restart the app.
- Multi-user synchronization. Multiple devices can share the same anchor, so everyone sees virtual objects aligned to the same physical space.
- Cross-session continuity. You can leave a space and come back later, and all the virtual elements will still be in the right place.
In AR/MR, your device builds a point cloud or feature map by using the camera and built-in sensors like the IMU (inertial measurement unit). Spatial anchors are then tied to those features, and without them, virtual objects can drift or float around as you move, shattering the sense of immersion.
Technical Mechanics of Spatial Anchors
At a high level, creating and using spatial anchors involves a series of steps:
Feature Detection & Mapping
To start, the device needs to understand its surroundings: it scans the environment to identify stable visual features (e.g., corners, edges). Over time, these features are triangulated, forming a sparse map or mesh of the space. This feature map is what the system relies on to anchor virtual objects.
Anchor Creation
Next, anchors are placed at specific 3D locations in the environment in two possible ways:
- Hit-testing. The system casts a virtual ray from a camera to a user-tapped point, then drops an anchor on the detected surface.
- Manual placement. Sometimes, developers need precise control, so they manually specify the exact location of an anchor using known coordinates, like ensuring it perfectly fits on the floor or another predefined plane.
Persistence & Serialization
Anchors aren’t temporary — they can persist, and here’s how systems make that possible:
- Locally stored anchors. Frameworks save the anchor’s data, like feature descriptors and transforms, in a package called a “world map” or “anchor payload”.
- Cloud-based anchors. Cloud services like Azure Spatial Anchors (ASA) upload this anchor data to a remote server to let the same anchor be accessed across multiple devices.
Synchronization & Restoration
When you’re reopening the app or accessing the anchor on a different device, the system uses the saved data to restore the anchor’s location. It compares stored feature descriptors to what the camera sees in real time, and if there’s a good enough match, the system confidently snaps the anchor into position, and your virtual content shows up right where it’s supposed to.
However, using spatial anchors isn’t perfect, like using any other technology, and there are some tricky issues to figure out:
- Low latency. Matching saved data to real-time visuals has to be quick; otherwise, the user experience feels clunky.
- Robustness in feature-scarce environments. Blank walls or textureless areas don’t give the system much to work with and make tracking tougher.
- Scale drift. Little errors in the system’s tracking add up over time to big discrepancies.
When everything falls into place and the challenges are handled well, spatial anchors make augmented and virtual reality experiences feel seamless and truly real.
ARKit’s Spatial Anchors (Apple)
Apple’s ARKit, rolled out with iOS 11, brought powerful features to developers working on AR apps, and one of them is spatial anchoring, which allows virtual objects to stay fixed in the real world as if they belong there. To do this, ARKit provides two main APIs that developers rely on to achieve anchor-based persistence.
ARAnchor & ARPlaneAnchor
The simplest kind of anchor in ARKit is the ARAnchor, which represents a single 3D point in the real-world environment and acts as a kind of “pin” in space that ARKit can track. Building on this, ARPlaneAnchor identifies flat surfaces like tables, floors, and walls, allowing developers to tie virtual objects to these surfaces.
ARWorldMap
ARWorldMap makes ARKit robust for persistence and acts as a snapshot of the environment being tracked by ARKit. It captures the current session, including all detected anchors and their surrounding feature points, into a compact file.
There are a few constraints developers need to keep in mind:
- World maps are iOS-only, which means they cannot be shared directly with Android.
- There must be enough overlapping features between the saved environment and the current physical space, and textured structures are especially valuable for this, as they help ARKit identify key points for alignment.
- Large world maps, especially those with many anchors or detailed environments, can be slow to serialize and deserialize, causing higher application latency when loading or saving.
ARKit anchors are ideal for single-user persistence, but sharing AR experiences across multiple devices poses additional issues, and developers often employ custom server logic (uploading ARWorldMap data to a backend), enabling users to download and use the same map.
However, this approach comes with caveats: it requires extra development work and doesn’t offer native support for sharing across platforms like iOS and Android.
ARCore’s Spatial Anchors (Google)
Google’s ARCore is a solid toolkit for building AR apps, and one of its best features is how it handles spatial anchors:
Anchors & Hit-Testing
ARCore offers two ways to create anchors. You can use Session.createAnchor(Pose) if you already know the anchor’s position, or you can use HitResult.createAnchor() if you want to define the anchor’s location based on the surface detected by the system. Once created, the position of an anchor is represented as a 3×4 transform matrix, giving you control over its placement.
Cloud Anchors (Alpha → Beta → Stable)
The Cloud Anchor API allows you to save your anchors to Google’s servers and share them across devices — including iOS clients using ARCore’s SDK for iOS.
There are a few catches to be aware of:
- Free-tier hosted anchors live for 24 hours. If you need them to last longer, you’ll need the Cloud Anchor API for business, which extends retention up to 365 days with quotas.
- Hosting an anchor works best when the environment has lots of unique features (like textured surfaces) and good lighting, so avoid plain or dimly lit spaces, as they make data capture harder, messing up the accuracy.
- If you’re hosting a lot of anchors in a small area, ARCore will take longer to resolve them because the system has more data to sift through.
ARCore’s Cloud Anchors enable cross-platform (Android ↔ iOS) multi-user experiences, giving an edge over ARKit, which is iOS-only. However, you’ll need to plan for API quotas and deal with the default retention limits if you’re not on the business tier.
Azure Spatial Anchors (Microsoft)
Microsoft’s Azure Spatial Anchors (ASA) is a cloud service designed to work across HoloLens, iOS, and Android, so you can create AR experiences without stressing over platform-specific details.
Cross-Platform SDK
ASA gives you a single SDK that’s compatible with Unity, Unreal, and native platforms (UWP, iOS, Android).
Anchor Persistence & Retrieval
When you create an anchor, ASA captures a 3D point cloud of its surroundings and securely uploads this data to Azure’s globally distributed backbone. What do you get? A unique 32-character unique Anchor ID that acts like a permanent address for your anchor in the cloud. And these anchors don’t have an expiration date, you decide when they’re no longer needed — they persist until you explicitly delete them.
Spatial Anchors CRUD
There are a few areas where Azure Spatial Anchors are great:
- Cross-platform consistency. ASA enables anchors to function across different ecosystems, including iOS, Android, HoloLens, and Magic Leap apps.
- Long-term persistence. Anchors don’t just disappear on you like they do with some other solutions. The default Azure account comes with a quota for 1,000 anchors, which should cover most projects. If not, you can scale up as needed.
- Scale & security. Since ASA is built into Azure’s ecosystem, enterprises can manage anchor data alongside other cloud resources, integrate with Azure Active Directory, and enforce role-based access.
- Environment requirements. One heads-up, though. ASA works best in textured environments. Large open spaces with few features (e.g., empty rooms) often fail to produce reliable anchors. But honestly, that’s the case with most AR tools now.
Azure Spatial Anchors is great for anyone building AR apps: it saves developers from dealing with all the platform-specific issues due to cross-platform support and long-term anchor persistence. Just make sure your environment has enough texture for the best results.
Real-World Use Cases
AR is being used in seriously impactful ways, and it’s wild to see some of the ways it’s being put to work. Check these out:
Multiplayer AR Games
The multiplayer app “Just a Line” by Google uses ARCore Cloud Anchors to allow users to draw in the air and see each other’s drawings as if they share the same canvas.
Meanwhile, Moth + Flame (Scavenger AR) uses ASA to let multiple players discover virtual items anchored to real-world locations.Players use their phones to find and collect these items, precisely placed using GPS.
Remote Assistance & Collaboration
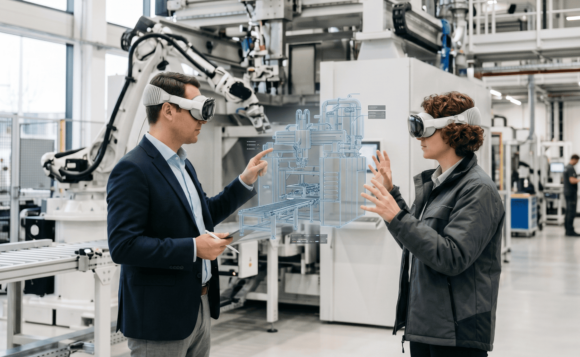
AR isn’t just for fun — it also solves serious problems. For example, ThyssenKrupp Elevator Service integrates HoloLens and ASA so remote experts can mark up a machine with virtual notes and arrows, which the technician on-site sees through their AR headset. The instructions stay locked to the specific parts of the equipment, making troubleshooting faster and cutting maintenance time by around 30%.
Industrial AR Navigation
Honeywell’s Connected Plant has workers using AR glasses that project virtual arrows onto the warehouse floor, guiding them along optimized paths to pick orders faster. And this saves tons of time on order picking — around 25% faster, actually. What’s even better, anchors ensure virtual arrows stay accurate shift after shift, so the system is always reliable.
Retail & Showroom Experiences
And, of course, we can’t skip how AR brings retail experiences closer to home: IKEA Place iOS app is a standout here. Using ARKit’s local anchors, customers can place virtual furniture in their rooms to see how it’ll look and fit (via hit-testing on detected planes) and save their room setups thanks to exporting and importing ARWorldMap data.
Limitations & Common Pitfalls
Even as the tools for spatial anchors improve, they have challenges as well.
Feature Scarcity in Environments
Some places just don’t provide enough visual details for anchors to work well — for example, empty white walls, uniform floors, or large glass areas with little texture. Anchors may fail to be created or matched reliably.
Dynamic environments add to the challenge: moving objects (people, equipment) can occlude reference features, leading to tracking issues.
Lighting Variations
Lighting matters more than you think: abrupt changes, like turning the lights off or moving to a darker area, can mess with how anchors are tracked, they may “jump” or even temporarily disappear as the system struggles to adjust.
Scale & Drift
Small tracking errors can pile up over time. The “drift” means virtual objects don’t stay exactly where they should. In this case, anchors recalibrate positioning, but virtual content can slowly diverge from intended positions without regular anchor updates.
Cross-Platform Discrepancies
Devices differently handle some basics. For example, iOS uses one type of coordinate system and Android another. While ASA translates between the two, developers still need to be careful when working with raw data.
Accuracy also varies: ARKit anchors may be more precise in small, highly textured rooms, whereas cloud anchors (ARCore/ASA) may take longer to resolve in feature-poor spaces.
Networking & Quotas
Cloud anchors rely on a good internet connection, and hosting or resolving anchors fails without it.
Free options like ARCore’s also come with limits: for instance, the free tier only keeps cloud anchors alive for 24 hours. If you’re working on large-scale projects and blow past your quota, everything will slow down or stop altogether unless you’ve set up a proper Azure SKU.
Best Practices & Recommendations
These tips will help make your spatial anchors work like a charm.
Environment Scanning
Instruct users to move slowly and sweep the device camera across all surfaces. The more details the system sees, like furniture, paintings, or posters, the better the anchors will perform. If there are plain walls or empty spaces, add some textures to your scanning route, and you’ll thank yourself later.
Anchor Density & Management
Don’t create anchors in one spot, create a mesh hierarchy instead. Start with a main anchor, then add secondary anchors for fine detail. If you’re not using anchors anymore, get rid of them to stay within service quotas (ASA) and reduce locate times.
Error Handling & Recovery
If an anchor suddenly stops tracking or becomes “limited”, show users a clear message, like “Re-scanning environment to find anchor…” to guide them. Re-scan the area regularly if you notice objects drifting out of place (for example, by more than 0.2 meters). If things still feel off, you should create a fresh anchor.
Cross-Platform Testing
Always test your setup on the devices you plan to use in real-world settings, like offices with fluorescent lights or spaces with natural daylight and some clutter.
Check how long it takes for an anchor to start working after launching. If it takes longer than five seconds to stabilize, it’s time to tweak it for better user experience.
Conclusion
Spatial anchors keep AR and MR experiences grounded, synchronized, and useful, they’re essential for persistence and multi-user synchronization. Each platform brings unique strengths:
- ARKit (iOS-only) does fast local mapping with ARWorldMap, great for single-user setups.
- ARCore (Android/iOS) lets you share across platforms with Cloud Anchors, though the free version only keeps them active briefly.
- Azure Spatial Anchors offers long-term, reliable syncing and cross-platform support, ideal for big, professional setups.
To get the most out of spatial anchors, you need to understand how they work. Know how they map spaces, where they’re strong, and where they’ll give you trouble. You’ll get better results by scanning environments thoughtfully, not overloading an area with anchors, and testing under real-world conditions on all your devices.
Latest Articles